
Data handling involves collecting, organizing, analyzing, and representing information using tools like tables, bar graphs, histograms, and pie charts. It helps us interpret large sets of data and make informed decisions based on patterns and trends. Understanding data handling is important for reading statistics, conducting surveys, and analyzing information in various fields. These Data Handling Grade 7 MCQ develop students' analytical skills with more complex data sets. By solving these 10 MCQs, students can check how well they can work with data and draw meaningful conclusions.
Determine the value of x if the mode of the following data is 5. 3, 12, 8, 5, x + 2, 6, 9, 10, 12, 5, 10
Answer: (a) 3
What is the probability of selecting a ball numbered with a multiple of 4 from the balls numbered 12 to 31?
Answer: (b) 1/4
The following data represents the height of students in cm: 152, 142, 132, 154, 156, 160, x, 140 If the mean height is x cm, what is the value of x?
Answer: (c) 148 cm
In a bar graph, the heights of two bars are 6.7 cm and 4.8 cm, respectively. If 1 cm = 60 units, then determine the difference in the values represented by the two bars.
Answer: (a) 114 units
The range of the data is 63.5. If the maximum value is five more than twice the minimum value, what is the maximum data value?
Answer: (c) 122
If 3 is added to each of the data values 3, 4, -3, 2, 6, 4, -2, -1, 5, then what will be the median of the data?
Answer: (d) 6
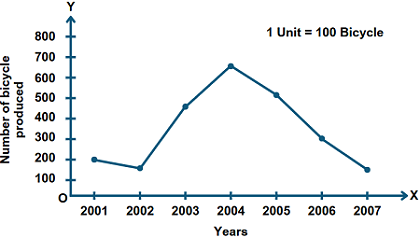
The following line graph illustrates the annual production of bicycles by a certain company from 2001 to 2007. What is the percent decrease in bicycle production from 2004 to 2005?
Answer: (b) 231⁄13%
Rachel finds the mean of 5 numbers. She observes that the first two numbers differ by 7, the third number is one less than the first number, the fourth number is five more than the first number and the fifth number is equal to the first number. If the mean of the 5 numbers is 30.2, then find the sum of the smallest and largest number.
Answer: (c) 62
Martin and Karl have two dice whose faces are numbered as 3, 4, 5, 6, 7, 8. What is the probability that the sum of the numbers obtained on both dice is equal to 12?
Answer: (d) 5/36
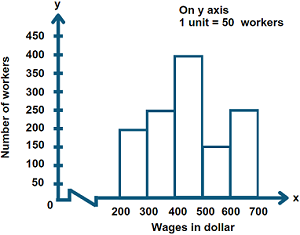
The histogram below represents the daily wages of workers at a construction site. What is the percentage of workers earning $500 or more compared to those earning less than $300 in daily wages?
Answer: (c) 200%
| Topic | Quiz |
|---|---|
| Algebraic Expressions | Quiz on Algebraic Expressions |
| Data Handling | Quiz on Data Handling |
| Simple Linear Equations | Quiz on Simple Linear Equations |
| Exponents and Powers | Quiz on Exponents and Powers |
| Fractions | Quiz on Fractions |
| Integers | Quiz on Integers |
| Mensuration | Quiz on Mensuration |
| Profit, Loss and Percentage | Quiz on Profit, Loss and Percentage |
| Ratio and Proportion | Quiz on Ratio and Proportion |
| Rational Numbers | Quiz on Rational Numbers |
| Symmetry and Visualising Solid Shapes | Quiz on Symmetry and Visualising Solid Shapes |
| Triangles | Quiz on Triangles |