
Statistics is the branch of mathematics that deals with collecting, organizing, analyzing, and interpreting data to draw conclusions. It uses measures like mean, median, mode, and range to summarize information and identify patterns. Understanding statistics is essential for making sense of data in science, economics, social studies, and everyday decision-making. This Statistics Quiz for Grade 9 challenges students to calculate and interpret various statistical measures. By attempting these 10 MCQs, students can check their ability to calculate and interpret statistical measures.
Which of the following measures remains unchanged for the given data set: 31, 48, 50, 60, 25, 8, 3x, 26, 32 (where x is between 10 and 15)?
Answer: (b) Range
Find the values of n and x̄ from the given expression.

Answer: (a) n = 30, x̄ = 11
A scientist at an agricultural college is studying the effect of a new fertiliser for raspberries. She measures the heights of the plants and also the total weight of fruit collected. She does this for two sets of plants: one with the new fertiliser and one without it. Here are the frequency polygons, What effect did the fertiliser have on the heights of the plants?
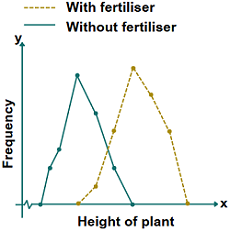
Answer: (d) The frequency polygon shifts to the right, peaking at taller heights and showing more taller plants with fertilizer.
Calculate the median salary of data. Salary (in thousand ₹) No. of persons 5-10 49 10-15 133 15-20 63 20-25 15 25-30 6 30-34 7 35-40 4 40-45 2 45-50 1
Answer: (a) $13.42
If x̄ is the mean of the ten natural numbers x1, x2, x3,…....,x10, what is the value of (x1 - x̄) + (x2 - x̄) + ….. +(x10 - x̄).
Answer: (c) 0
In a class of 20 students, 10 boys brought 11 books each and 6 girls brought 13 books each. Remaining students brought atleast one book each and no two students brought the same number of books. If the average number of books brought in the class is a positive integer, then what could be the total number of books brought by the remaining students?
Answer: (b) 12
Find the value of mode of the given frequency distribution Class: 100 - 110 110 - 120 120 - 130 130 - 140 140 - 150 150 - 160 160 - 170 Frequency: 4 6 20 32 33 8 2
Answer: (c) 140.9
The given figure represents the percentage of marks on the X-axis and the number of students on Y-axis. Find the number of students who scored less than or equal to 50% of marks.
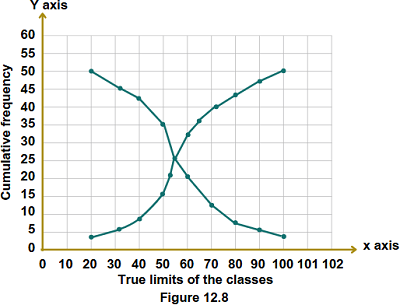
Answer: (b) 15
A family has 38 films on DVD with a mean playing time of 1 hour 32 minutes. They also have 26 films on video cassette, with a mean playing time of 2 hours 4 minutes. Find the mean playing time of all the films in their collection.
Answer: (d) 1 hr 45 min
If X, M, Z are denoting mean, median and mode of a data and X : M = 9 : 8, then find the ratio M : Z.
Answer: (b) 4 : 3
| Topic | Quiz |
|---|---|
| Circles | Quiz on Circles |
| Coordinate Geometry | Quiz on Coordinate Geometry |
| Euclid's Geometry | Quiz on Euclid's Geometry |
| Heron's Formula | Quiz on Heron's Formula |
| Lines and Angles | Quiz on Lines and Angles |
| Linear Equations in Two Variables | Quiz on Linear Equations in Two Variables |
| Polynomials | Quiz on Polynomials |
| Probability | Quiz on Probability |
| Quadrilaterals | Quiz on Quadrilaterals |
| Rational and Irrational Numbers | Quiz on Rational and Irrational Numbers |
| Statistics | Quiz on Statistics |
| Surface, Area and Volume | Quiz on Surface, Area and Volume |
| Trigonometry | Quiz on Trigonometry |
| Triangles | Quiz on Triangles |