
Data handling is the process of collecting, organizing, analyzing, and presenting information using tools like tables, bar graphs, and pie charts. It helps us make sense of large amounts of information and draw useful conclusions from it. Understanding data handling is important for interpreting surveys, reports, and statistics in school and real life. This Data Handling Grade 6 Quiz helps students develop critical skills in organizing and interpreting information. Students can attempt these 10 MCQs to check their ability to read, interpret, and organize data effectively.
How many students scored less than 40, if the marks of the students are as follows: 78, 87, 90, 35, 65, 88, 56, 63, 48, 31, 39, 82, 86, 93, 49
Answer: (b) 3
Determine the value of 2x + 5, given that x is the mean of the following data set: 1, 2, 4, 7, 6
Answer: (b) 13
A survey recorded the number of family members in 20 different families as below: 2, 3, 5, 6, 7, 4, 8, 9, 10, 2, 5, 3, 4, 6, 8, 7, 2, 3, 6, 5 How many families have 5 or more members?
Answer: (d) 12
Find the mean height, if the height of boys (in cm) in a camp are as follows: 165, 169, 173, 179, 162, 170, 165, 174, 175, 170, 168, 166, 173, 180, 176
Answer: (b) 171
Find the number of students above 18 years, if the ages ( in years) of 40 students of a class in a school are as follows: Age 17 18 19 20 21 Number of Students 6 9 11 9 5
Answer: (d) 25
A shop sold a total of 350 books in the months of January, March, August, May, and December. On representing the number of books sold in these five months on a pie chart, the central angle for the number of books sold in March is 108°. Calculate the number of books sold in March.
Answer: (d) 105
A batsmen scores 65, 15, 8, 32, 81 in the first five matches. How much he should score in the sixth match so that his average score would be 42?
Answer: (a) 51
The sum of the minimum and maximum values of the data set is 90. If the range of the data is 26, then determine the minimum and maximum values.
Answer: (c) 32, 58
Find the median, if the mean of mathematics marks of 20 students is 48 and the marks are as follows: 45, 56, 38, 36, 65, 48, x, 40, 39, 49, 50, 62, 45, 29, 61, 54, 52, 49, 61, 30
Answer: (c) 49
The expenditure of a person (in dollars) on different items during a month is represented below by a pie chart. Find his spending on health and clothing for a year, if he spends the same every month.
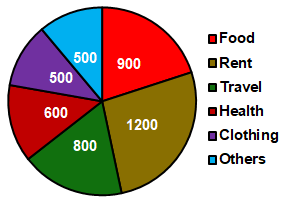
Answer: (a) 13200
| Topic | Quiz |
|---|---|
| Algebraic Expressions | Quiz on Algebraic Expressions |
| Area, Perimeter and Volume | Quiz on Area, Perimeter and Volume |
| Comparing Quantities | Quiz on Comparing Quantities |
| Data Handling | Quiz on Data Handling |
| Decimals | Quiz on Decimals |
| Fractions | Quiz on Fractions |
| Basic Geometrical Ideas and Symmetry | Quiz on Basic Geometrical Ideas and Symmetry |
| Knowing Our Numbers | Quiz on Knowing Our Numbers |
| Understanding Elementary Shapes (2D and 3D Shapes) | Quiz on Understanding Elementary Shapes (2D and 3D Shapes) |