Data handling is the process of collecting, organizing, and interpreting information to draw meaningful conclusions. It involves creating tables, charts, and graphs to represent data in a clear and visual way. The Data Handling Quiz for Class 5 helps you analyze patterns, compare information, and make informed decisions. This skill is useful in subjects like mathematics, science, and social studies, and also in everyday situations. Attempt these 10 MCQs to evaluate how well you understand data handling and its applications.
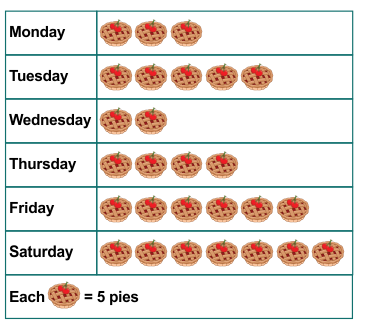
The table shows the number of pies sold in a bakery shop in a week. On which day the sale of pies was half of the pies sold on Friday?
Answer: (b) Monday
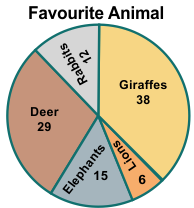
A survey was conducted in school where students were asked their favourite animal. The pie chart shows the results of the survey. Which is the second least fravourite animal?
Answer: (c) Rabbit
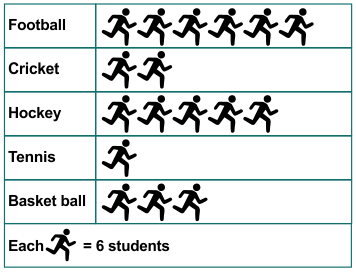
The pictograph shows the favourite sport of students of class IV. How many more students like hockey than basketball?
Answer: (c) 12
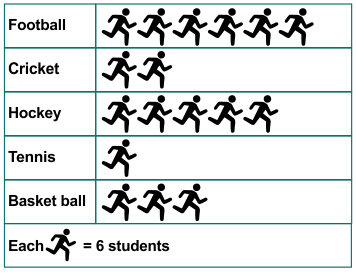
The pictograph shows the favourite sport of students of class IV. Which of the following fractions shows the number students liking tennis to the number of students liking basketball?
Answer: (b)
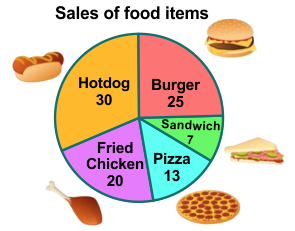
The pie chart shows the sales of some food items on a particular day in a restaurant. Which food item had sales 8 less than half the number of sales of hotdogs?
Answer: (a) 7
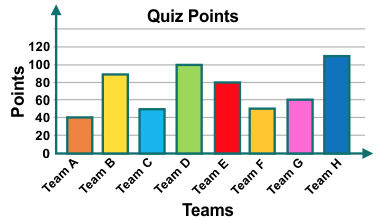
The bar graph shows the points scored by eight different reams in a quiz. What is the difference in the points between the winning team and the losing team?
Answer: (c) 70
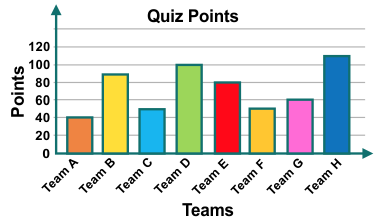
The bar graph shows the points scored by eight different reams in a quiz. The scores of which two teams together will be equal to the score of the winning team?
Answer: (d) F and G
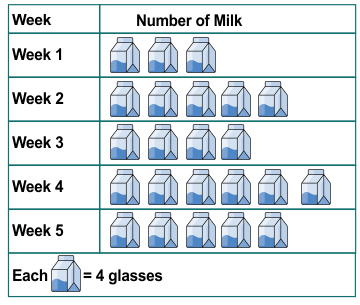
The pictograph shows the number of glasses of milk Eric drank every week. How many total glasses of milk did he drink in week 3 and 4?
Answer: (d) 40
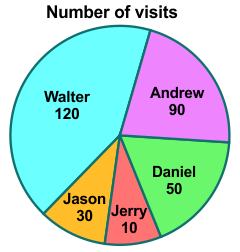
The piechart shows the number of times five friends visited a cafe. Which friend made 40 visits less than thrice the number of visits made by Jason?
Answer: (b) Daniel
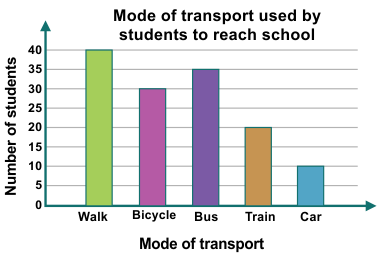
The bar graph shows the mode of transport used by students to reach the school daily. What fraction of the total number students used bicycle to reach to the school?
Answer: (a)
| Topic | Quiz |
|---|---|
| Number Names | Quiz on Number Names |
| Computation Operations | Quiz on Computation Operations |
| Fractions | Quiz on Fractions |
| Measurements | Quiz on Measurements |
| Time and Temperature | Quiz on Time and Temperature |
| Money | Quiz on Money |
| Geometry | Quiz on Geometry |
| Perimeter | Quiz on Perimeter |
| Data Handling | Quiz on Data Handling |