
Data handling is the process of collecting, organizing, interpreting, and presenting information using tables, charts, and graphs. It helps us understand large sets of numbers and draw meaningful conclusions from them. Learning data handling is important because it develops analytical thinking and prepares students to work with information in school and beyond. The Data Handling Quiz for Grade 4 challenges students to analyze and interpret data effectively. These 10 MCQs will allow students to evaluate their ability to read, organize, and interpret data accurately.
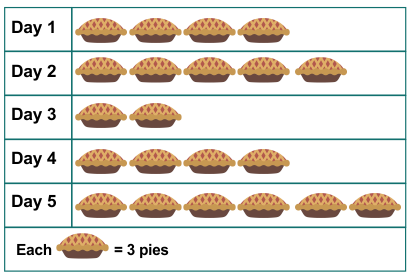
The table shows the number of pies sold on five different days by a bakery. On which day did the bakery sell two-fifths of the number of pies sold on day 2?


Answer: (b)
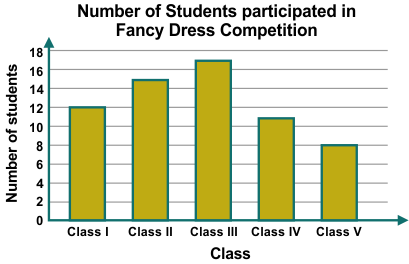
The bar graph here shows the number of students who participated from each class in a fancy dress competition. From which class was the participation one less than double the number of participants from the class with the least number of participants?




Answer: (b)
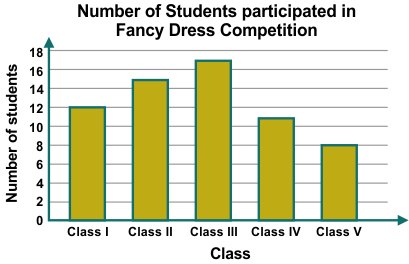
The bar graph here shows the number of students who participated from each class in a fancy dress competition. From which class was the participation two-thirds of the participation from Class I?




Answer: (d)
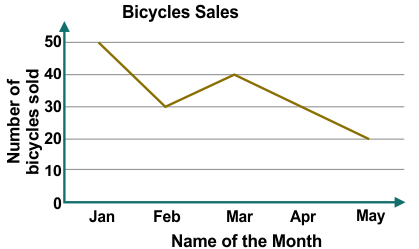
The line graph shows the number of bicycles sold from January to May in a bicycle store. In which month four-seventeenths of the total number of bicycles were sold?




Answer: (c)
The pictograph shows the number of runs made by different players in a cricket tournament. Who scored five-sevenths of the runs scored by Mark?
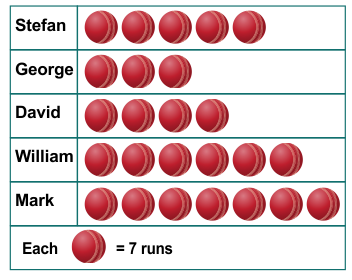




Answer: (a)
The pie chart shows the voting results of the favourite outdoor activity of different people. Which of the following statements is correct?
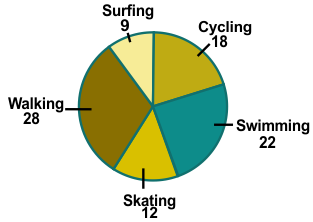
Answer: (b) The number of people who chose skating is two-thirds the number of people who chose cycling.
The pie chart shows the voting results of the favourite outdoor activity of different people. Which of the following outdoor activities got the number of votes divisible by 7?
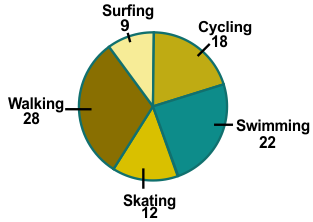




Answer: (d)
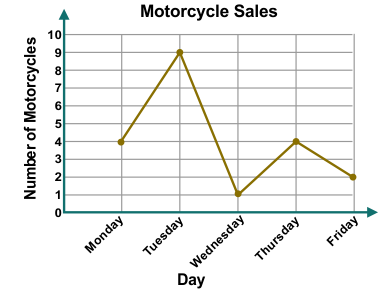
The line graph shows the number of motorcycles sold on different days of the week. How many total motorcycles were sold from Monday to Friday?
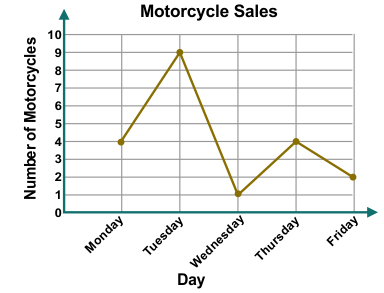


Answer: (c)
The line graph shows the number of motorcycles sold on different days of the week. Which of the following statements is NOT correct?
Answer: (d) The sale on Friday is double the sale on Thursday.
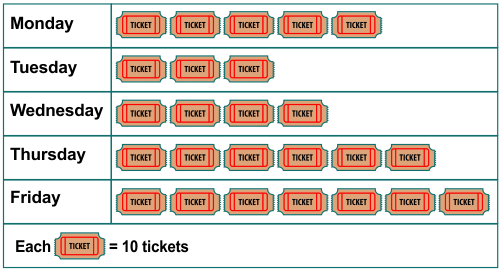
The pictogram shows number of movie tickets sold from Monday to Friday. On which day, one-fifth of the total number of tickets were sold?




Answer: (a)
| Topic | Quiz |
|---|---|
| Area and Perimeter | Quiz on Area and Perimeter |
| Data Handling | Quiz on Data Handling |
| Fractions and Decimals | Quiz on Fractions and Decimals |
| Expressions, Equations and Relationship | Quiz on Expressions, Equations and Relationship |
| Geometry | Quiz on Geometry |
| Length, Weight and Capacity | Quiz on Length, Weight and Capacity |
| Number Sense | Quiz on Number Sense |
| Temperature | Quiz on Temperature |
| Time | Quiz on Time |