
Data handling is the process of collecting, organizing, interpreting, and presenting information using statistical tools like frequency tables, histograms, pie charts, and measures of central tendency. It helps us make sense of data and draw meaningful conclusions from surveys, experiments, and reports. Learning data handling is important for analyzing information in science, social studies, and everyday decision-making. These Data handling questions for Grade 8 challenge students to work with more complex data sets and statistical concepts. Students can attempt these 10 MCQs to evaluate their ability to work with data and interpret it accurately.
If a frequency distribution is created for the number of persons x in a household using class intervals such as (1−4), (5−8), (9−12) etc. What condition must the number of persons x satisfy to fall within the class interval (5 − 8)?
Answer: (d) 5 ≤ x ≤ 8
A sample of 15 measurements has a mean of 12.8, and a sample of 25 measurements has a mean of 18.2. Find the mean of all 40 measurements.
Answer: (c) 16.18
A person distributed his total property among his three sons. The ratio of total property, share of first son, and the share of the second son is 24 : 7 : 8. Find the central angle of sector, which represents the share of the third son.
Answer: (b) 135o
The average weight of 40 students in a class is 25.2 kg. If the average weight of all the boys is 29 kg and the average weight of all the girls is 23 kg, and it is known that the ratio of boys to girls in the class is 3 : 5. Calculate the total weight of the boys and the girls separately.
Answer: (a) boys - 435 kg girls - 575 kg
Choose the incorrect statement. This graph shows the percentage of births in Brazil for two years (1960 and 2000), according to the mother’s age at the time of birth. A) Half of the births 960 were to mothers aged 25-29. B) There were fewer mothers who gave birth aged 15-19 in 2000 than in 1960. C) In 1960, the median age of mothers who gave birth was in the 20-24 age group.
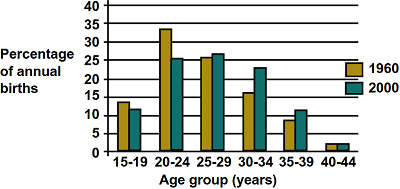
Answer: (a) only a
The mean age of a class of students is 16 years. The class teacher, aged 40 years, is included, which increases the mean age to 17 years. The principal, who is 50 years old, then joins the group, further increasing the mean age to 18 years. How many students are in the class?
Answer: (d) 23
Anna spends different hours of a working day as follows. If Anna decides to reduce her sleep by 2 hours and use that time for play. What is the difference in central angles for sleep and play in the pie chart. Activity Number of hours Job 8 Piano 2 Play 3 Sleep 8 Other 3
Answer: (d) 15o
Read the passage and answer the following question: A school conducted a survey to find out how many hours students spent studying per week. The survey results are summarised below: Hours Studied (h) 0-4 5-9 10-14 15-19 20-24 25-29 Number of Students (f) 3 7 12 10 5 3 Calculate the mean number of hours studied.
Answer: (b) 14 hours
Read the passage and answer the following question: A large e-commerce platform conducted a survey to understand the distribution of customer purchases across different product categories in the past year. The categories included Electronics, Fashion, Home & Kitchen, Books & Media, and Health & Beauty. The total revenue generated for the year was £5,000,000. The following pie chart shows the percentage contribution of each category to the total revenue. By how much would the revenue from Electronics decrease if its market share reduces to 30% next year, assuming the total revenue remains the same?
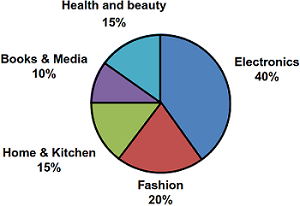
Answer: (c) £500,000 decrease
Read the passage and answer the following question: A large e-commerce platform conducted a survey to understand the distribution of customer purchases across different product categories in the past year. The categories included Electronics, Fashion, Home & Kitchen, Books & Media, and Health & Beauty. The total revenue generated for the year was £5,000,000. The following pie chart shows the percentage contribution of each category to the total revenue. If the company wants to maintain the same revenue from Books & Media next year but anticipates the total revenue will increase by 15%, what would the new market share of Books & Media be?
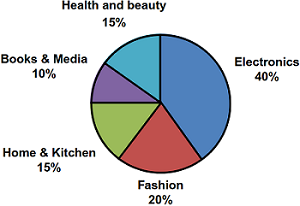
Answer: (c) 8.70%
| Topic | Quiz |
|---|---|
| Algebraic Expressions and Identities | Quiz on Algebraic Expressions and Identities |
| Comparing Quantities | Quiz on Comparing Quantities |
| Cubes and Cube Roots | Quiz on Cubes and Cube Roots |
| Data Handling | Quiz on Data Handling |
| Direct and Indirect Proportion | Quiz on Direct and Indirect Proportion |
| Exponents and Powers | Quiz on Exponents and Powers |
| Factorisation | Quiz on Factorisation |
| Linear Equations in One and Two Variable | Quiz on Linear Equations in One and Two Variable |
| Mensuration | Quiz on Mensuration |
| Probability | Quiz on Probability |
| Rational Numbers | Quiz on Rational Numbers |
| Squares and Square Roots | Quiz on Squares and Square Roots |
| Understanding Quadrilaterals | Quiz on Understanding Quadrilaterals |